Agile visualization is a crucial part of app development that helps teams collaborate, communicate, and track progress effectively. By turning complex data into visual representations, teams can easily understand project goals, progress, and dependencies. This approach streamlines processes, improves communication, and enables quick adaptation to changing requirements.
Key Benefits of Agile Visualization
- Streamline processes: Reduce waste and increase predictability
- Improve communication: Ensure everyone is on the same page
- Respond to change: Quickly adapt to changing requirements and priorities
Choosing an Agile Methodology
Agile FrameworkDescriptionAdvantagesDisadvantagesScrumIterative and incremental frameworkImproves team collaboration, flexibility, and productivityCan be too rigid for small teams or simple projectsKanbanVisual system for managing workEnhances workflow transparency, flexibility, and delivery speedLacks structured iterations and ceremoniesXPIterative and incremental frameworkEmphasizes technical practices, customer satisfaction, and team collaborationCan be too extreme for large teams or complex projectsFDDIterative and incremental frameworkFocuses on feature delivery, simplicity, and team collaborationCan be too rigid for changing requirements or prioritiesAPFAdaptive framework for managing projectsOffers flexibility, scalability, and risk managementCan be too complex for small teams or simple projects
Selecting Agile Visualization Tools
- Jira: Popular for agile workflow support, custom boards, issue tracking, and project management
- Trello: Visual project management tool with boards and cards for flexible workflow tracking
Setting Up Visualization Boards
- Design board layout with columns for Backlog, To-Do, In Progress, and Done
- Customize boards with additional columns for specific project needs
Planning and Tracking Development Sprints
- Visualize sprints and progress using burndown charts
- Regularly review and adjust iterations based on feedback and insights
Managing Work Items Visually
- Use story mapping for a big picture view of user stories, epics, and tasks
- Apply Kanban boards with work limits to optimize workflow and productivity
Enhancing Team Collaboration with Visualization
- Share real-time data for informed decision-making and reduced miscommunication
- Support remote teams visually for effective collaboration and communication
Adapting Processes with Visual Insights
- Track project velocity and iteration success using metrics like lead time, cycle time, throughput, and defect rate
- Implement continuous improvement by analyzing metrics and optimizing workflows
sbb-itb-8abf120
Understanding Agile Visualization Basics
Agile visualization is a crucial aspect of app development. It helps teams collaborate, communicate, and track progress effectively.
Defining Your App Development Goals
Before using agile visualization, identify your app's core purpose, target users, and market objectives. This alignment ensures your visualization tools support your business goals. Ask yourself:
- What problem does my app solve for users?
- Who is my target audience?
- What are the key performance indicators (KPIs) for my app's success?
Why Visualization Matters in Agile
Agile visualization is essential for effective communication, iteration tracking, and stakeholder collaboration in agile development. It helps teams:
BenefitsDescriptionStreamline processesReduce waste and increase predictability by visualizing workflows and dependencies.Improve communicationEnsure everyone is on the same page with clear, concise, and up-to-date information.Respond to changeQuickly adapt to changing requirements and priorities with real-time visualization.
By understanding the importance of agile visualization, you can unlock the full potential of your app development team and deliver high-quality products that meet customer needs.
Choosing an Agile Methodology
When developing an app, you need to choose an agile methodology that fits your project's needs. This section will help you understand the different agile frameworks and select the one that works best for your team and project.
Comparing Agile Frameworks
Here's a comparison of popular agile frameworks:
Agile FrameworkDescriptionAdvantagesDisadvantagesScrumIterative and incremental frameworkImproves team collaboration, flexibility, and productivityCan be too rigid for small teams or simple projectsKanbanVisual system for managing workEnhances workflow transparency, flexibility, and delivery speedLacks structured iterations and ceremoniesXPIterative and incremental frameworkEmphasizes technical practices, customer satisfaction, and team collaborationCan be too extreme for large teams or complex projectsFDDIterative and incremental frameworkFocuses on feature delivery, simplicity, and team collaborationCan be too rigid for changing requirements or prioritiesAPFAdaptive framework for managing projectsOffers flexibility, scalability, and risk managementCan be too complex for small teams or simple projects
Matching Methodology to Project Needs
To choose the right agile methodology, consider the following factors:
- Team size and structure: Larger teams may benefit from Scrum or FDD, while smaller teams may prefer Kanban or XP.
- Project complexity: Complex projects may require APF or Scrum, while simpler projects may be suitable for Kanban or XP.
- Development environment: Teams working in a fast-paced environment may prefer Kanban or XP, while those in a more traditional setting may choose Scrum or FDD.
- Customer involvement: Projects with high customer involvement may benefit from Scrum or XP, while those with low customer involvement may prefer Kanban or FDD.
By understanding the strengths and weaknesses of each agile framework and considering your project's specific needs, you can choose the methodology that best fits your team and project requirements.
Selecting Agile Visualization Tools
When choosing agile visualization tools, it's essential to consider the features that support agile processes. In this section, we'll explore the key criteria for selecting popular visualization tools.
Jira for Agile Workflow Support
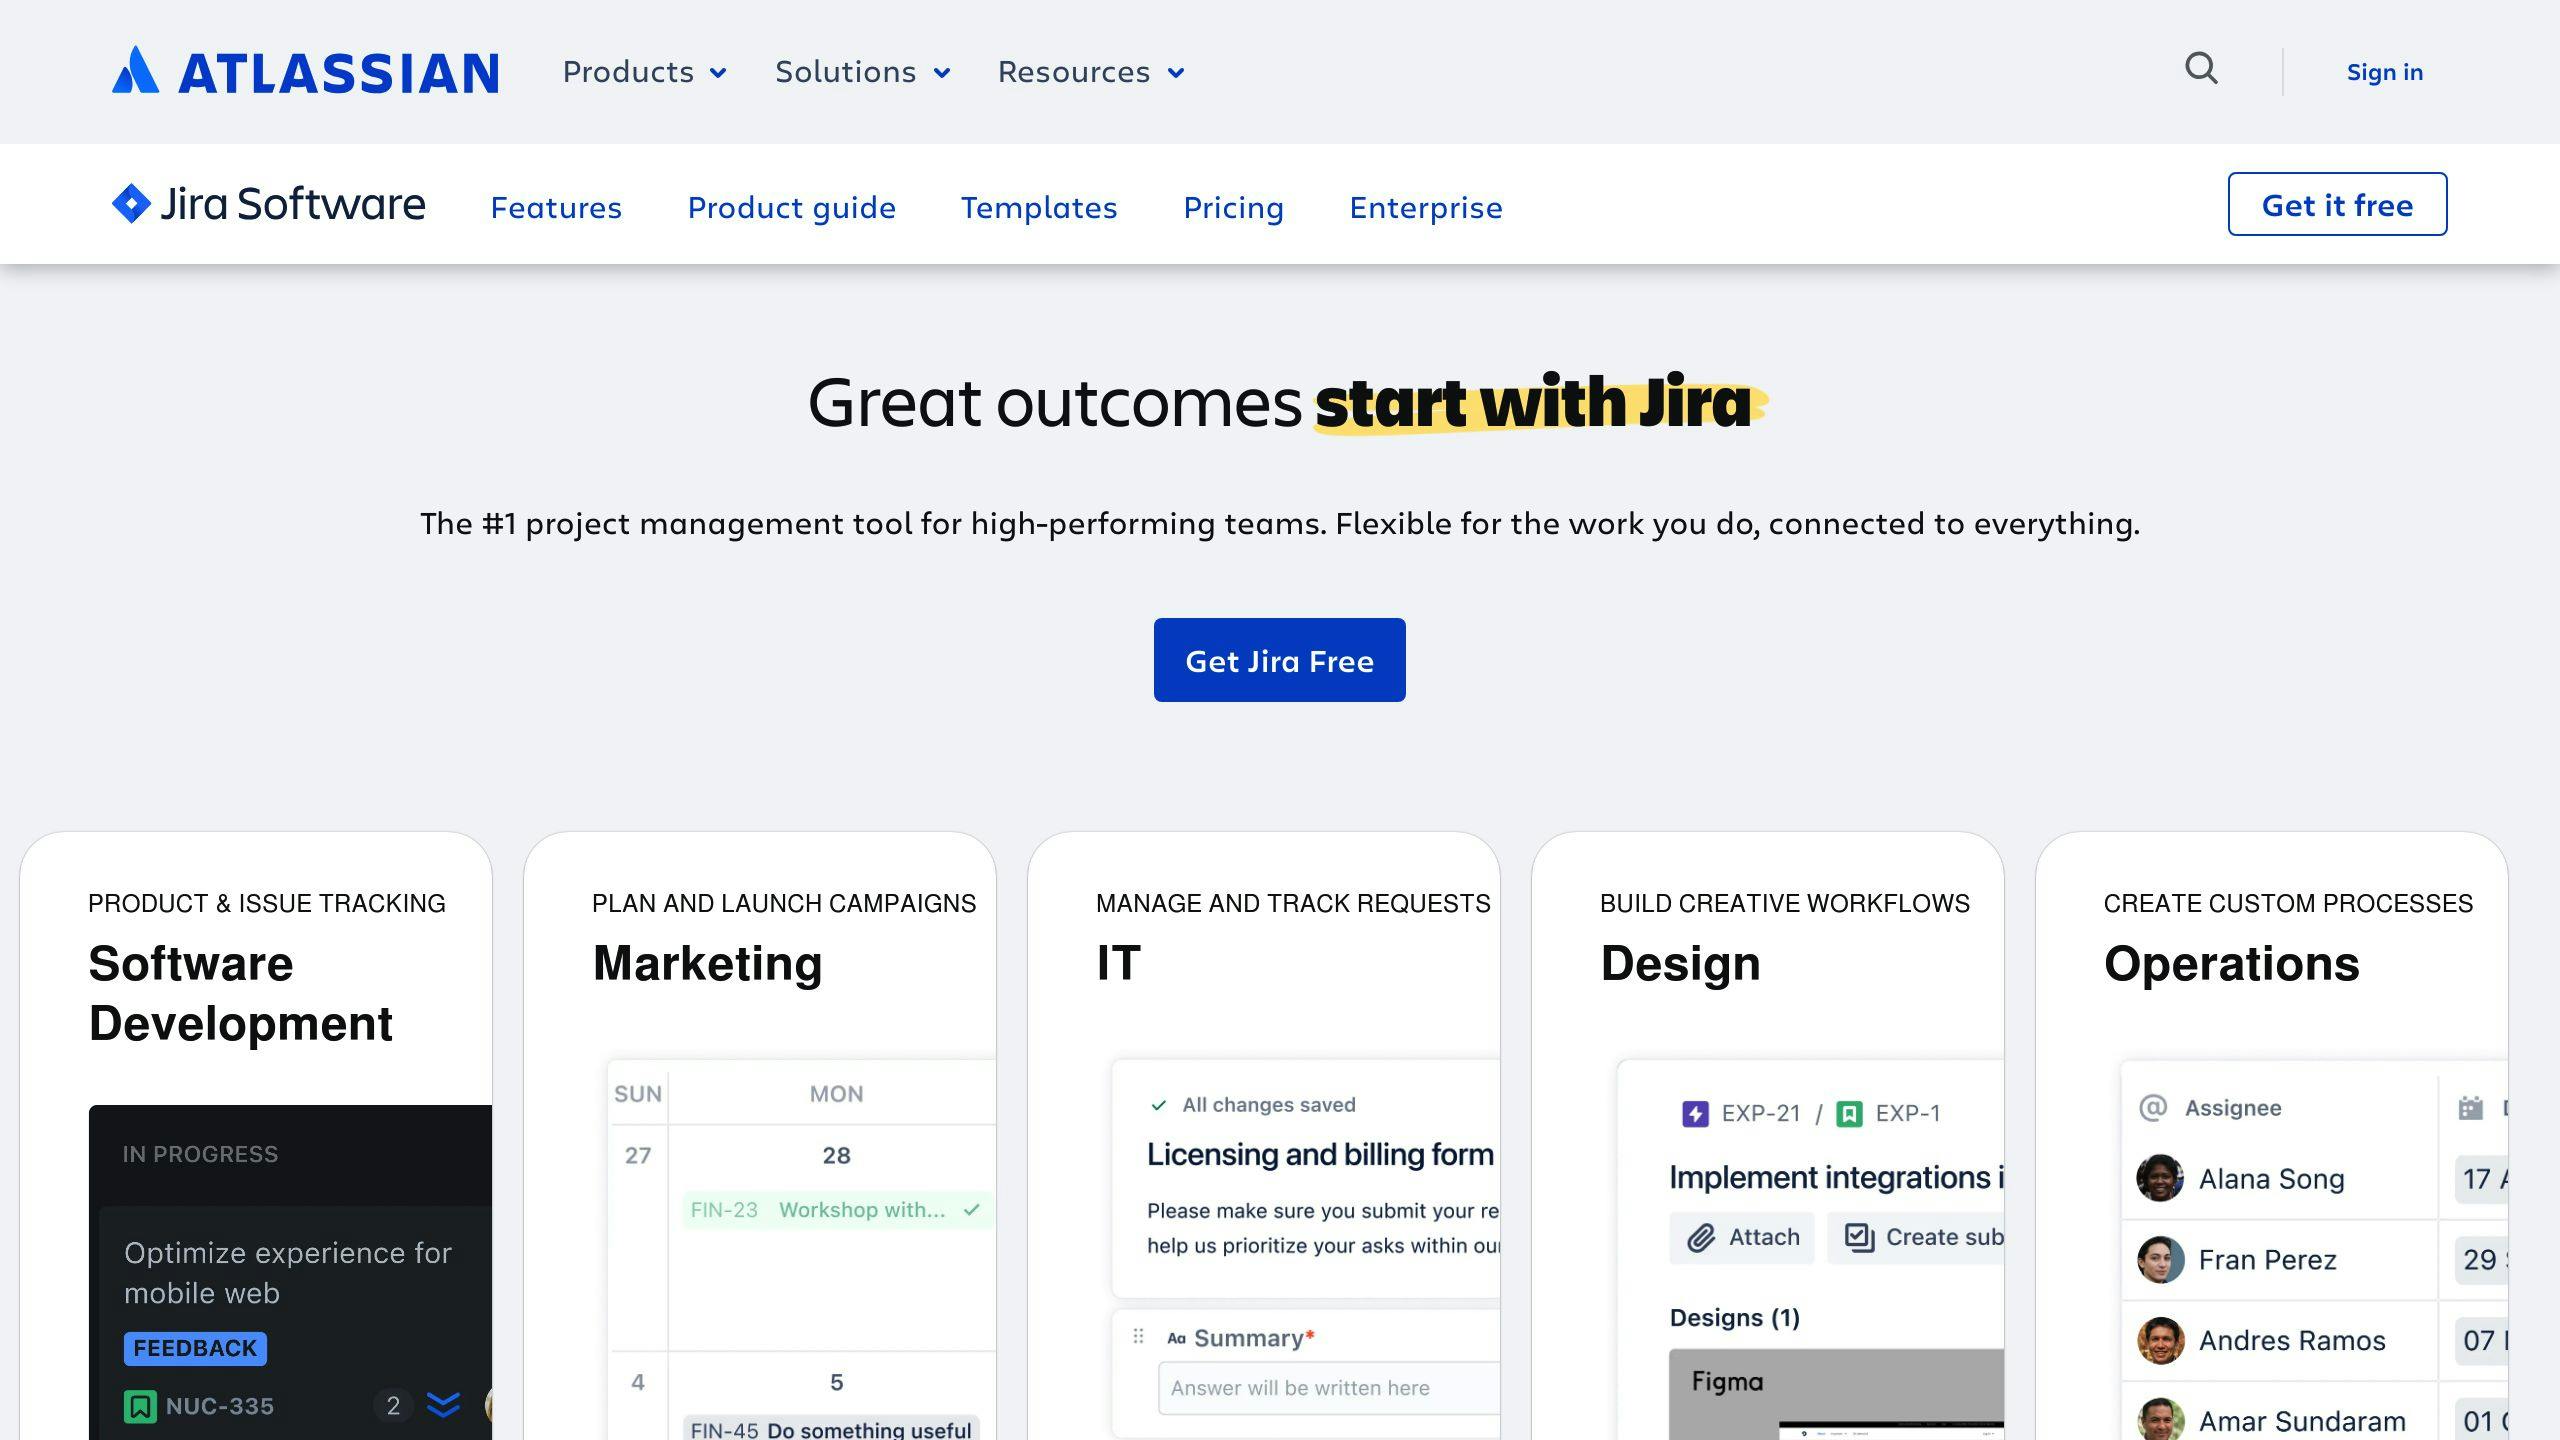
Jira is a popular choice for agile workflow support. It offers a range of features that cater to agile development teams. With Jira, you can:
FeatureDescriptionCreate custom boardsTailor boards to your team's specific needsTrack issuesManage issues across multiple projectsManage projectsEasily manage projects, including workflows and reporting
Jira's structured approach to agile workflows makes it an ideal choice for teams that require a high degree of control and customization. Its robust reporting features provide valuable insights into project progress, making it easier to identify areas for improvement.
Trello for Visual Project Management
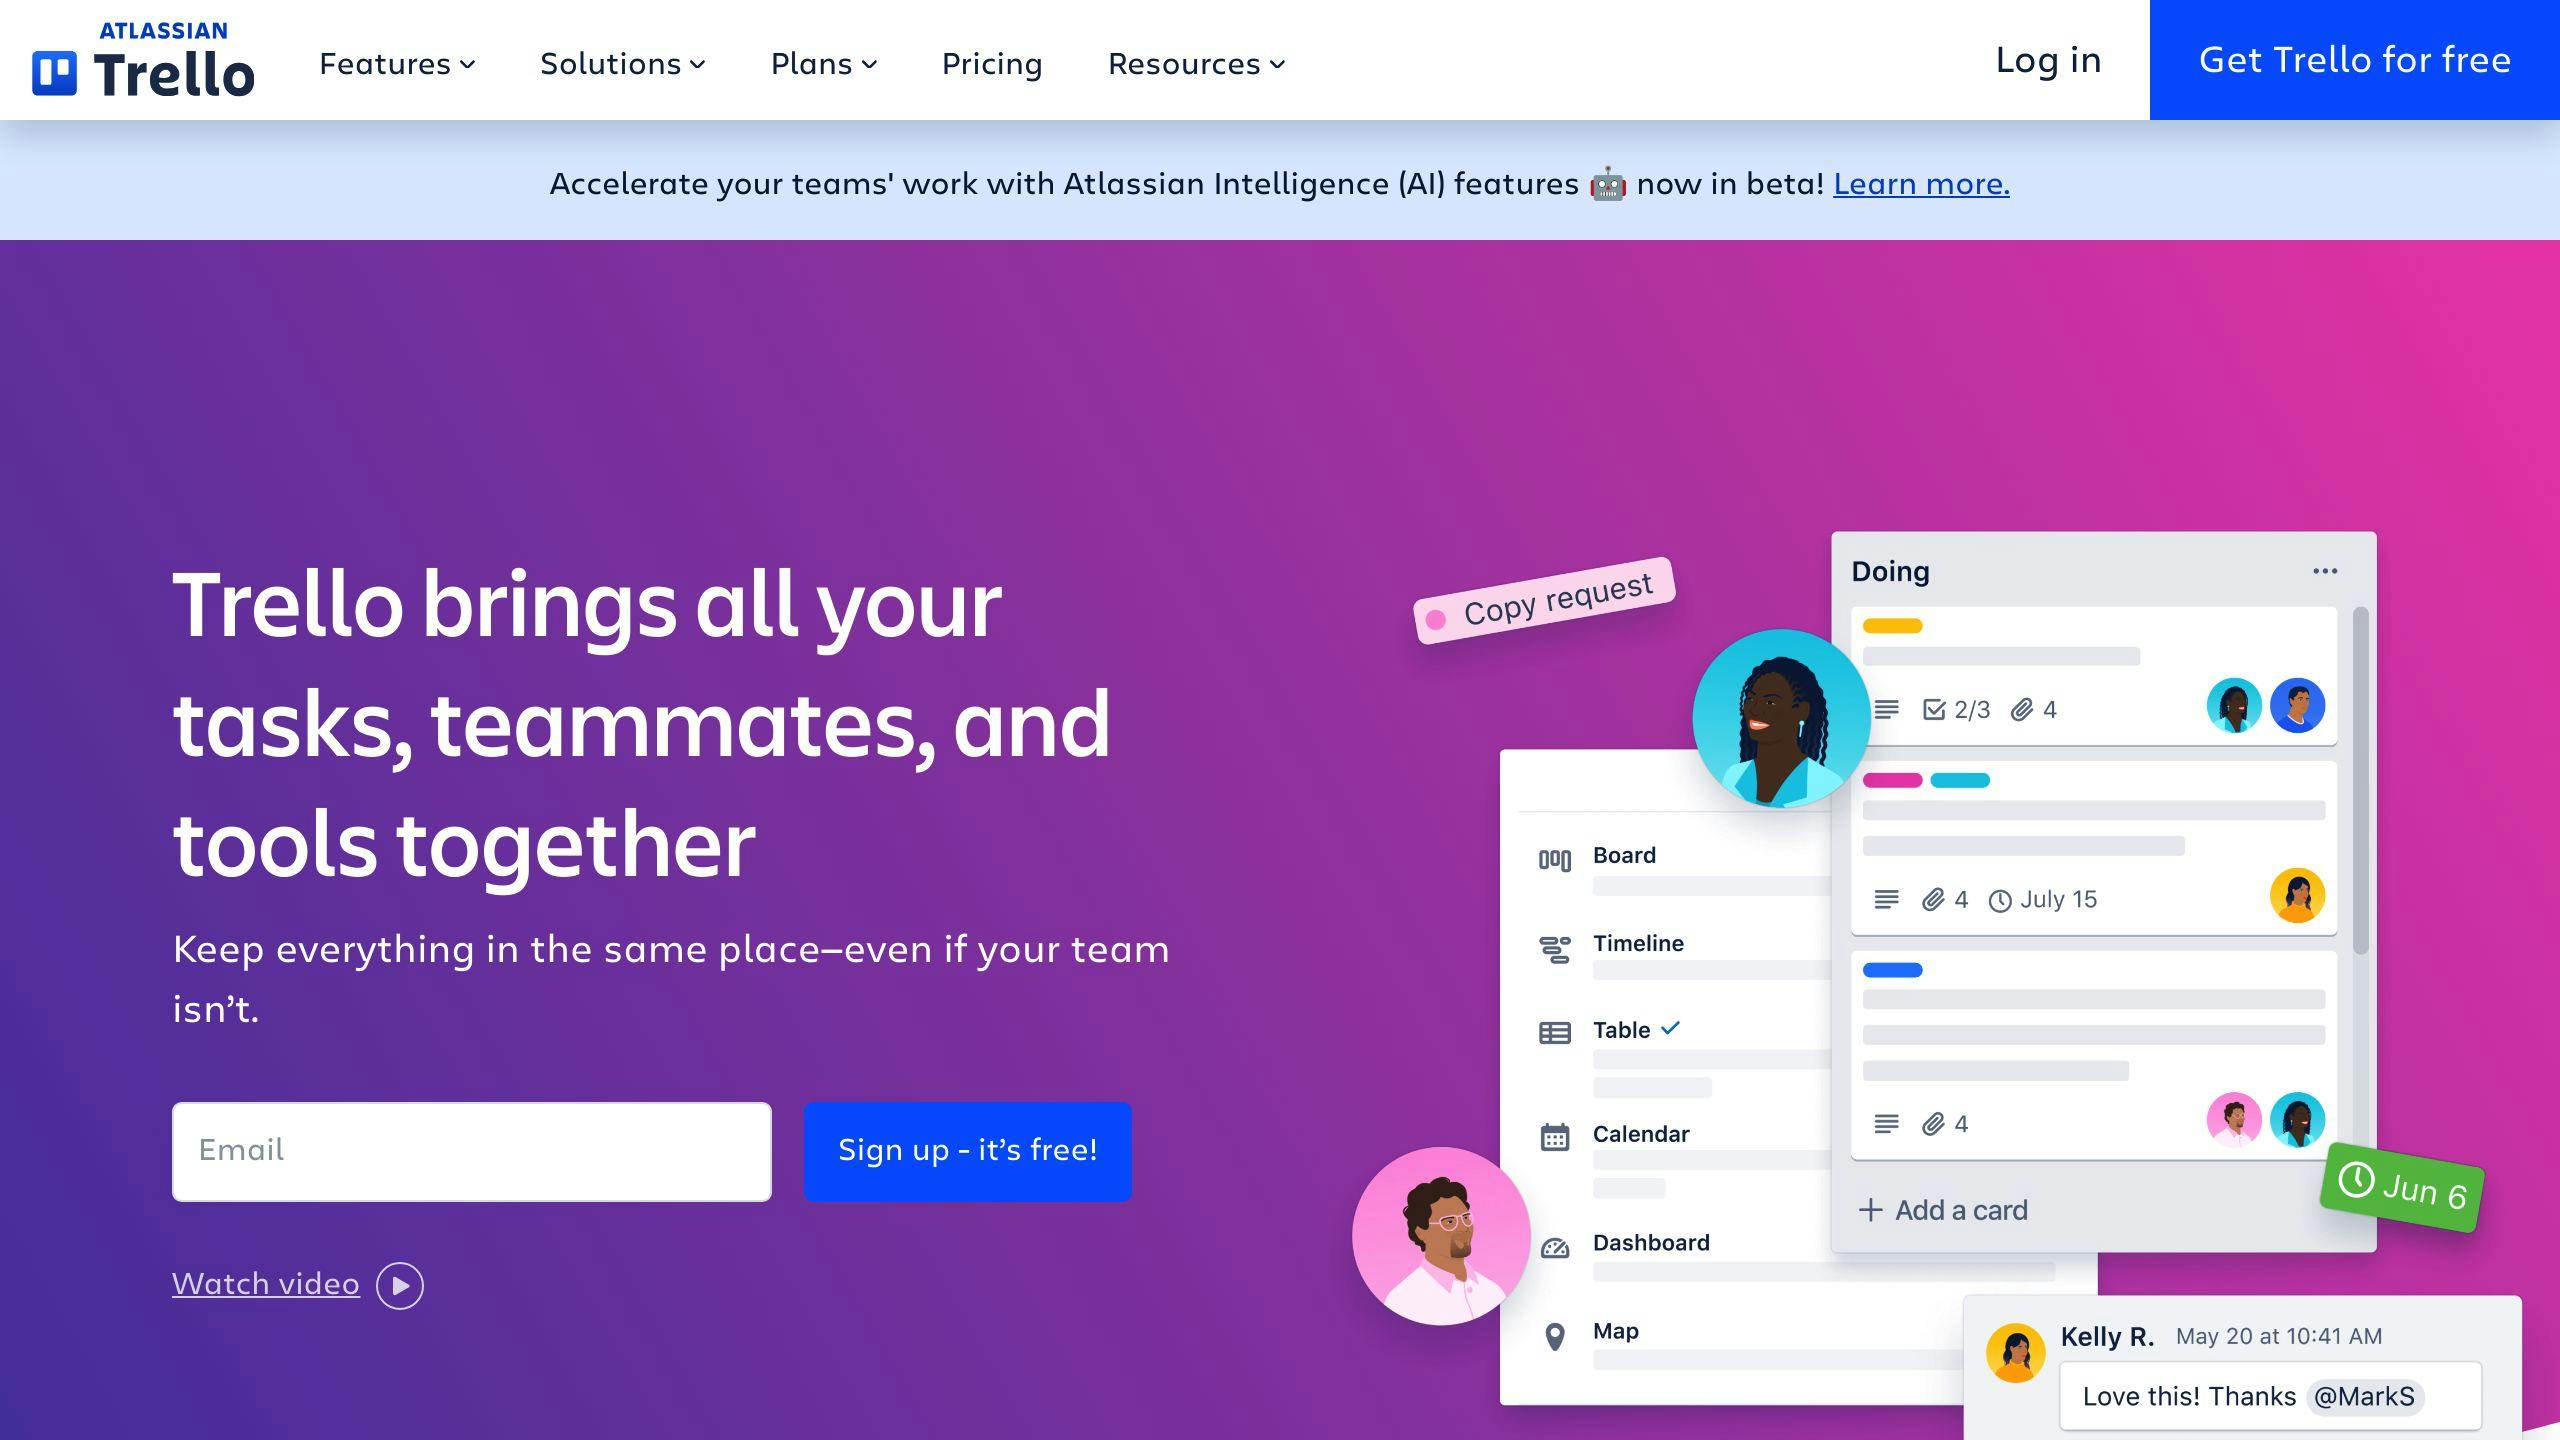
Trello is a visual project management tool perfect for agile teams. Its board-and-card system provides a flexible and intuitive way to track project progress, making it easy to visualize workflows and identify bottlenecks.
FeatureDescriptionVisual boardsCreate boards that visualize your project workflowCard systemTrack tasks and issues using Trello's card systemCustomizationAdapt Trello to your team's specific needs
Trello's ease of use and flexibility make it an excellent choice for teams that require a high degree of customization.
Evaluating Tool Integration
When selecting an agile visualization tool, it's crucial to evaluate how well it integrates with your existing development environment and third-party applications. Consider the following integration factors:
IntegrationDescriptionDevelopment toolsIntegrate with popular development tools, such as GitHub or BitbucketProject management toolsIntegrate with other project management tools, such as Asana or Microsoft TeamsAPIs and SDKsLeverage APIs and SDKs to customize integrations and extend tool functionality
By evaluating tool integration, you can ensure that your chosen tool fits seamlessly into your existing workflow.
Setting Up Visualization Boards
Setting up visualization boards is a crucial step in agile project management. A well-designed board helps teams visualize workflow stages, track project progress, and identify bottlenecks.
Designing a Board Layout
When designing a board layout, consider the workflow stages and project tracking requirements. A typical board layout includes columns for:
ColumnDescriptionBacklogList of tasks or user stories to be completedTo-DoTasks assigned to team members, awaiting completionIn ProgressTasks currently being worked on by team membersDoneCompleted tasks or user stories
Customizing Boards for Your Project
Customize the board to reflect unique aspects of your project. This may include adding columns for:
- Urgent tasks
- Priority features
- Specific project milestones
- Stakeholder feedback or approval
- Compliance tracking
By customizing the board, you can ensure it remains a valuable tool for team collaboration and project tracking.
Planning and Tracking Development Sprints
To ensure successful agile project management, it's crucial to plan and track development sprints effectively. This involves mapping out iterations within the agile visualization tool and keeping track of progress transparently.
Visualizing Sprints and Progress
Use visualization techniques to plan sprint tasks and track sprint progress through burndown charts. Burndown charts help teams analyze their work progress and determine when they can fulfill project end goals.
To plan and track development sprints effectively:
StepDescription1Confirm estimated story points for all items on the backlog (or, at minimum, in the next sprint)2Agree on the items to move to the new sprint3Determine the team's capacity for the upcoming sprint and compare it with the total story points proposed4End the meeting with a Q&A to ensure all team members are on the same page
Reviewing and Adjusting Iterations
Regularly review iteration outcomes and use visualization data to make informed adjustments for future sprints. During the sprint review, discuss what went well, identify potential roadblocks, and summarize the results of the sprint review.
By regularly reviewing and adjusting iterations, teams can:
- Learn from previous sprints by considering sprint review and retrospective insights
- Identify potential roadblocks before they occur
- Bring stakeholder feedback into the planning process
- Account and plan for dependencies that may impact the flow of work
Managing Work Items Visually
Visualizing work items is essential in agile development. It helps teams prioritize, categorize, and manage tasks effectively.
Using Story Mapping for a Big Picture View
Story mapping is a technique used to visualize user stories and their relationships to epics and tasks. This approach provides a comprehensive view of the project, enabling teams to prioritize and categorize work items into iterations.
Story Mapping ElementsDescriptionBackboneThe basis of the map, consisting of epics or themes that describe overall user activities in the systemUser StoriesArranged in both vertical and horizontal dimensions, describing more specific tasks a user may requireUser PersonasFictional representations of people that will use the product/perform steps described in user storiesIdeas and Nice-to-HaveSections that keep in mind user stories that are not required yet or not stated in initial requirements, but still add value to the product
Applying Kanban for Work Limits
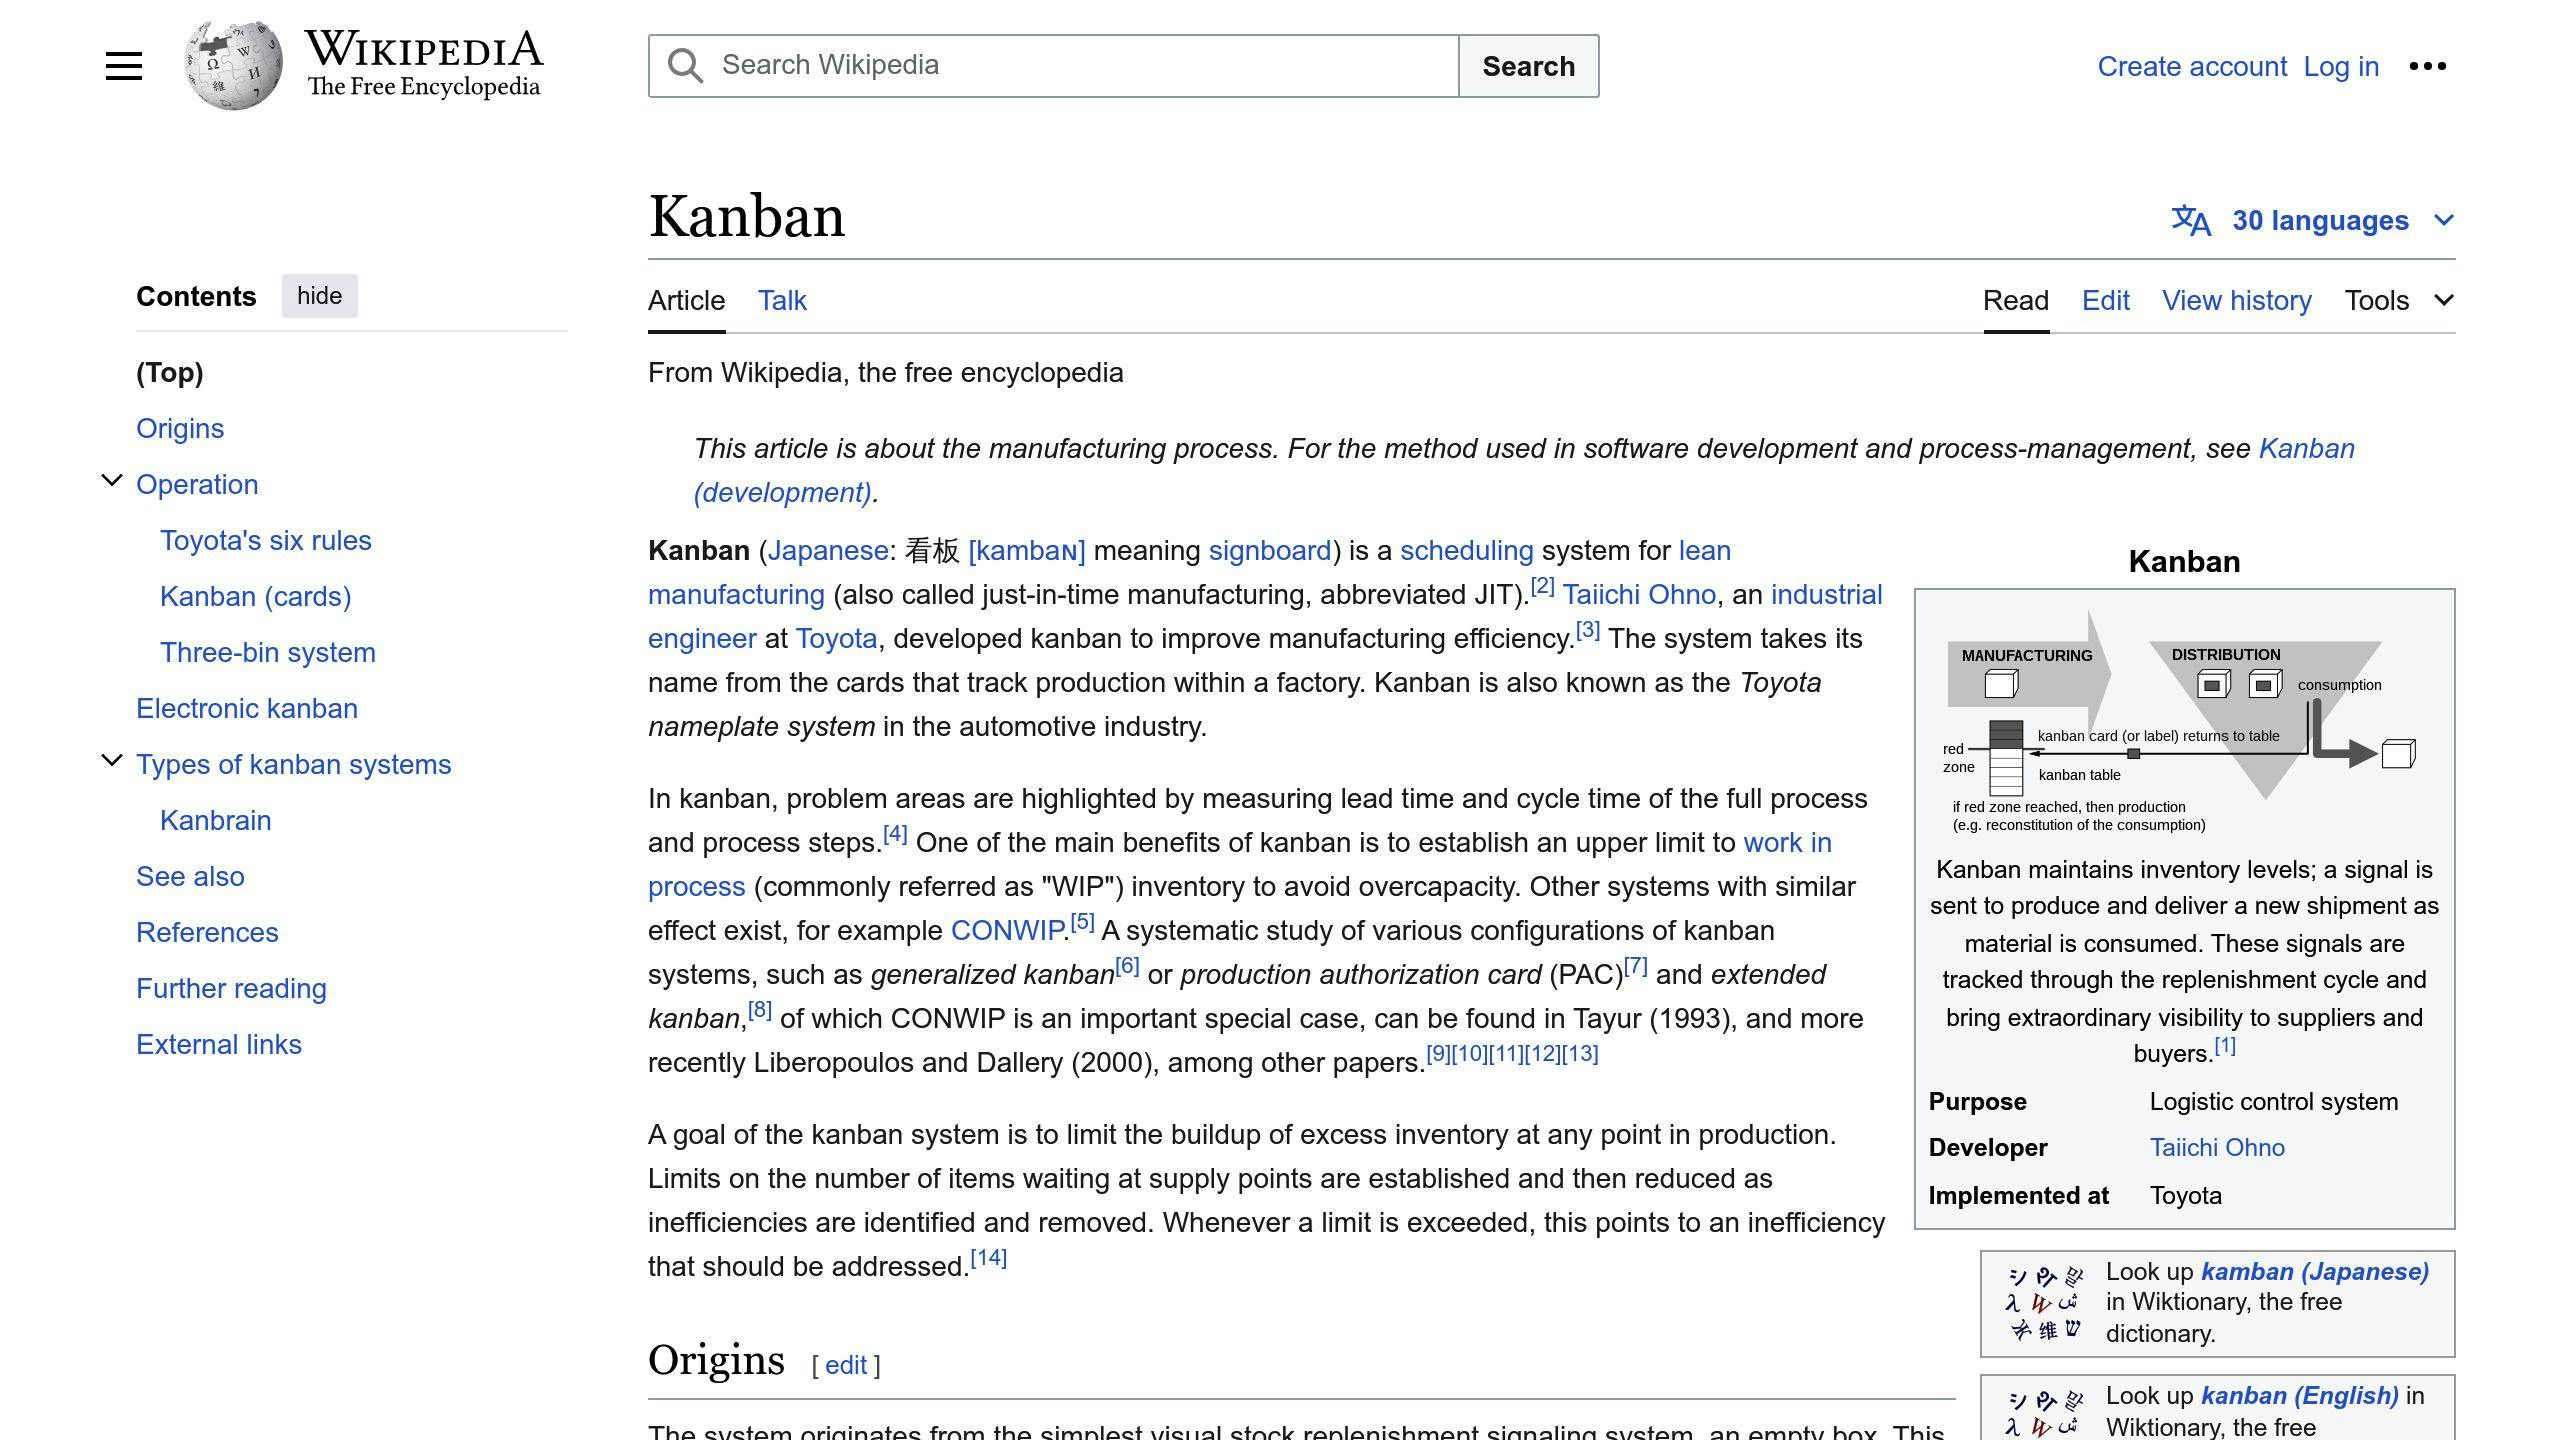
Kanban boards help teams visualize the workflow, identify bottlenecks, and optimize the development process. By setting work limits, teams can focus on a manageable amount of work, reducing the risk of overwhelming and increasing productivity.
To apply Kanban effectively:
1. Define workflow stages and set work limits: Establish clear workflow stages and set limits for each stage to ensure a manageable workload.
2. Visualize the workflow: Use a Kanban board to visualize the workflow, making it easier to identify bottlenecks and optimize the development process.
3. Identify and address bottlenecks: Continuously monitor the workflow and address bottlenecks to ensure smooth task throughput.
4. Continuously improve the workflow: Regularly review and refine the workflow to optimize task throughput and increase productivity.
Enhancing Team Collaboration with Visualization
Effective team collaboration is crucial in agile development, and visualization plays a vital role in achieving this goal. By using visualization tools, teams can improve communication, increase stakeholder engagement, and facilitate more effective decision-making throughout the development process.
Sharing Real-time Data for Decisions
Sharing real-time data is essential for teams to make informed decisions quickly. Visualization tools enable teams to access up-to-date data, facilitating immediate feedback and decision-making. This approach ensures that all team members are on the same page, reducing misunderstandings and miscommunication.
Benefits of Real-time DataDescriptionInformed DecisionsMake quick and informed decisions with up-to-date dataReduced MiscommunicationEnsure all team members are on the same pageImmediate FeedbackFacilitate immediate feedback and decision-making
Supporting Remote Teams Visually
With the rise of remote work, visualization tools have become essential for supporting distributed teams. These tools enable teams to collaborate effectively, regardless of their location. Visualization facilitates remote collaboration by providing a shared understanding of the project's progress, goals, and objectives.
Benefits of Visualization for Remote TeamsDescriptionShared UnderstandingProvide a shared understanding of project progress, goals, and objectivesEffective CollaborationEnable teams to collaborate effectively, regardless of locationSeamless CommunicationFacilitate seamless communication and collaboration
By leveraging visualization tools, teams can enhance collaboration, improve communication, and increase stakeholder engagement. By sharing real-time data and supporting remote teams visually, teams can work more effectively, respond quickly to changes, and deliver high-quality products.
Adapting Processes with Visual Insights
Adapting processes with visual insights is crucial in agile development. By using visualization tools, teams can track project velocity and iteration success, and make data-driven decisions to improve their workflow.
Tracking Project Velocity and Iteration Success
To track project velocity and iteration success, teams can use metrics such as lead time, cycle time, throughput, and defect rate. These metrics provide valuable insights into the development process, enabling teams to identify areas for improvement.
MetricDescriptionLead TimeTime taken for a task to be completed from start to finishCycle TimeTime taken for a task to be completed once it's startedThroughputNumber of work items completed in a certain periodDefect RateNumber of defects per unit of work
Implementing Continuous Improvement
By regularly reviewing and analyzing metrics, teams can identify areas for improvement and implement changes to optimize their workflow. This approach enables teams to respond quickly to changes, improve efficiency, and deliver high-quality products.
For example, by tracking throughput, teams can identify periods of high productivity and implement changes to sustain that level of productivity. Similarly, by tracking defect rate, teams can identify areas where defects are most common and implement changes to reduce defects.
By adapting processes with visual insights, teams can improve their workflow, respond quickly to changes, and deliver high-quality products. By leveraging metrics and visual feedback, teams can optimize their development process and achieve their goals.
Conclusion: The Value of Agile Visualization
Agile visualization is a crucial aspect of app development projects. By using agile visualization, teams can improve collaboration, simplify complex workflows, and make informed decisions. This approach helps teams adapt to changing project requirements, improve efficiency, and deliver high-quality products.
Key Benefits of Agile Visualization
Agile visualization offers several benefits, including:
BenefitDescriptionImproved CollaborationEnhance team collaboration and communicationSimplified WorkflowsBreak down complex workflows into manageable tasksInformed Decision-MakingMake data-driven decisions with real-time insights
Optimizing Development Processes
By leveraging agile visualization, teams can refine their development process, reduce defects, and improve overall project outcomes. This approach fosters a culture of continuous improvement, enabling teams to respond quickly to changes and optimize their workflow.
In today's fast-paced app development landscape, agile visualization is essential for project success. By embracing agile visualization, teams can stay ahead of the curve, deliver high-quality products, and drive business success.

